Do you need meaningful reports from your production and process data? KRIS Reporting makes evaluating machine data, energy consumption, and batch data easier than ever before. Whether you need to create daily reports for management, detailed batch logs for quality assurance, or compliance documentation for authorities, KRIS Reporting automatically generates all evaluations in professional quality.
Work in a Familiar Environment - With Microsoft Excel
No need to learn new software or undergo complicated training: KRIS Reporting uses Microsoft Excel to display your reports. You create and format your evaluations in the familiar Excel interface, while Microsoft SQL Server reliably manages your process data in the background. This allows you to visualize even complex KPIs, energy indicators, and production data in a clear and understandable way – without any special IT knowledge.
Maximum flexibility in data evaluation
- Aggregated data or raw data: Choose between condensed key figures or detailed curve data for your analysis
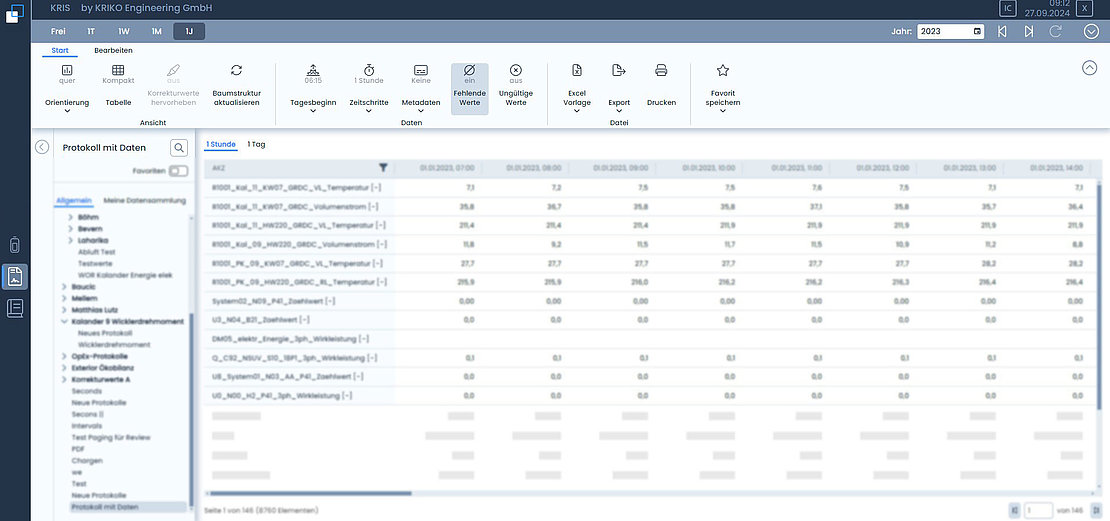
- Direct editing in KRIS: Create simple evaluations even without Excel—directly in the app with table view
- Integrated unit conversion: Convert measured values directly into other units (e.g., kWh to MWh, m³ to liters)
- Data compression: Compress raw data into larger time intervals for better comparability

![[Translate to English:] Daniel Siebrecht](/fileadmin/bilder/mitarbeiter/Siebrecht_Daniel_L.jpg "[Translate to English:] Daniel Siebrecht")
![[Translate to English:] Oliver Nann](/fileadmin/bilder/mitarbeiter/Nann_Oliver_L.jpg "[Translate to English:] Oliver Nann")


